


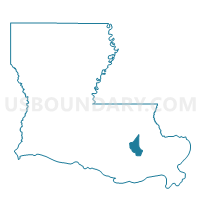
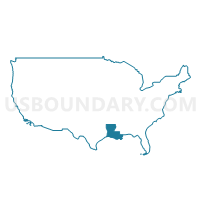
Census Tract 601, St. Charles Parish, Louisiana
About
Outline

Summary
| Unique Area Identifier | 461014 |
| Name | Census Tract 601 |
| County | St. Charles Parish |
| State | Louisiana |
| Area (square miles) | 69.91 |
| Land Area (square miles) | 15.33 |
| Water Area (square miles) | 54.59 |
| % of Land Area | 21.92 |
| % of Water Area | 78.08 |
| Latitude of the Internal Point | 30.05757400 |
| Longtitude of the Internal Point | -90.37316410 |
| Total Population | 1,937 |
| Total Housing Units | 675 |
| Total Households | 635 |
| Median Age | 33.9 |
Maps

Graphs
Select a template below for downloading or customizing gragh for Census Tract 601, St. Charles Parish, Louisiana


Neighbors
Neighoring Census Tract (by Name) Neighboring Census Tract on the Map
- Census Tract 205.17, Jefferson Parish, LA
- Census Tract 624, St. Charles Parish, LA
- Census Tract 625, St. Charles Parish, LA
- Census Tract 627, St. Charles Parish, LA
- Census Tract 701, St. John the Baptist Parish, LA
- Census Tract 710, St. John the Baptist Parish, LA
- Census Tract 711, St. John the Baptist Parish, LA
- Census Tract 9548, Tangipahoa Parish, LA
- Census Tract 9900, Jefferson Parish, LA
Top 10 Neighboring County Subdivision (by Population) Neighboring County Subdivision on the Map
- District 4, Jefferson Parish, LA (89,653)
- District 9, Tangipahoa Parish, LA (12,918)
- District 5, St. Charles Parish, LA (8,445)
- District 3, St. Charles Parish, LA (8,022)
- District 6, St. Charles Parish, LA (7,755)
- District 5, St. John the Baptist Parish, LA (7,681)
- District 1, St. Charles Parish, LA (7,545)
- District 1, St. John the Baptist Parish, LA (5,509)
Top 10 Neighboring Place (by Population) Neighboring Place on the Map
- Laplace CDP, LA (29,872)
- Hahnville CDP, LA (3,344)
- Norco CDP, LA (3,074)
- Edgard CDP, LA (2,441)
- Montz CDP, LA (1,918)
- Killona CDP, LA (793)
- Taft CDP, LA (63)
Top 10 Neighboring Unified School District (by Population) Neighboring Unified School District on the Map
- Jefferson Parish School District, LA (432,552)
- Tangipahoa Parish School District, LA (121,097)
- St. Charles Parish School District, LA (52,780)
- St. John the Baptist Parish School District, LA (45,924)
Top 10 Neighboring State Legislative District Lower Chamber (by Population) Neighboring State Legislative District Lower Chamber on the Map
- State House District 73, LA (54,461)
- State House District 58, LA (48,350)
- State House District 56, LA (47,201)
- State House Districts not defined, LA (0)
Top 10 Neighboring State Legislative District Upper Chamber (by Population) Neighboring State Legislative District Upper Chamber on the Map
- State Senate District 18, LA (156,556)
- State Senate District 6, LA (137,299)
- State Senate District 19, LA (127,628)
- State Senate Districts not defined, LA (0)
Top 10 Neighboring 111th Congressional District (by Population) Neighboring 111th Congressional District on the Map
Top 10 Neighboring 5-Digit ZIP Code Tabulation Area (by Population) Neighboring 5-Digit ZIP Code Tabulation Area on the Map
Explore Neighbors on the MapData
Demographic, Population, Households, and Housing Units
** Data sources from census 2010 **
Show Data on Map
Download Full List as CSV
Download Quick Sheet as CSV
| Subject | This Area | St. Charles Parish | Louisiana | National |
|---|---|---|---|---|
| POPULATION | ||||
| Total Population Map | 1,937 | 52,780 | 4,533,372 | 308,745,538 |
| POPULATION, HISPANIC OR LATINO ORIGIN | ||||
| Not Hispanic or Latino Map | 1,863 | 50,132 | 4,340,812 | 258,267,944 |
| Hispanic or Latino Map | 74 | 2,648 | 192,560 | 50,477,594 |
| POPULATION, RACE | ||||
| White alone Map | 1,584 | 36,540 | 2,836,192 | 223,553,265 |
| Black or African American alone Map | 312 | 14,051 | 1,452,396 | 38,929,319 |
| American Indian and Alaska Native alone Map | 1 | 172 | 30,579 | 2,932,248 |
| Asian alone Map | 11 | 440 | 70,132 | 14,674,252 |
| Native Hawaiian and Other Pacific Islander alone Map | 0 | 21 | 1,963 | 540,013 |
| Some Other Race alone Map | 7 | 709 | 69,227 | 19,107,368 |
| Two or More Races Map | 22 | 847 | 72,883 | 9,009,073 |
| POPULATION, SEX | ||||
| Male Map | 980 | 26,085 | 2,219,292 | 151,781,326 |
| Female Map | 957 | 26,695 | 2,314,080 | 156,964,212 |
| POPULATION, AGE (18 YEARS) | ||||
| 18 years and over Map | 1,352 | 38,572 | 3,415,357 | 234,564,071 |
| Under 18 years | 585 | 14,208 | 1,118,015 | 74,181,467 |
| POPULATION, AGE | ||||
| Under 5 years | 147 | 3,696 | 314,260 | 20,201,362 |
| 5 to 9 years | 164 | 3,799 | 306,362 | 20,348,657 |
| 10 to 14 years | 174 | 4,131 | 306,836 | 20,677,194 |
| 15 to 17 years | 100 | 2,582 | 190,557 | 12,954,254 |
| 18 and 19 years | 47 | 1,430 | 136,222 | 9,086,089 |
| 20 years | 26 | 591 | 68,251 | 4,519,129 |
| 21 years | 12 | 558 | 67,763 | 4,354,294 |
| 22 to 24 years | 57 | 1,834 | 202,295 | 12,712,576 |
| 25 to 29 years | 129 | 3,427 | 332,925 | 21,101,849 |
| 30 to 34 years | 142 | 3,397 | 295,508 | 19,962,099 |
| 35 to 39 years | 162 | 3,350 | 276,479 | 20,179,642 |
| 40 to 44 years | 177 | 3,910 | 288,120 | 20,890,964 |
| 45 to 49 years | 164 | 4,485 | 325,046 | 22,708,591 |
| 50 to 54 years | 153 | 4,360 | 329,329 | 22,298,125 |
| 55 to 59 years | 93 | 3,442 | 292,567 | 19,664,805 |
| 60 and 61 years | 23 | 1,160 | 103,687 | 7,113,727 |
| 62 to 64 years | 42 | 1,393 | 139,308 | 9,704,197 |
| 65 and 66 years | 18 | 756 | 76,663 | 5,319,902 |
| 67 to 69 years | 23 | 950 | 101,702 | 7,115,361 |
| 70 to 74 years | 30 | 1,245 | 133,629 | 9,278,166 |
| 75 to 79 years | 24 | 1,015 | 102,876 | 7,317,795 |
| 80 to 84 years | 19 | 722 | 77,301 | 5,743,327 |
| 85 years and over | 11 | 547 | 65,686 | 5,493,433 |
| MEDIAN AGE BY SEX | ||||
| Both sexes Map | 33.90 | 36.50 | 35.80 | 37.20 |
| Male Map | 33.00 | 35.40 | 34.50 | 35.80 |
| Female Map | 35.40 | 37.50 | 37.20 | 38.50 |
| HOUSEHOLDS | ||||
| Total Households Map | 635 | 18,557 | 1,728,360 | 116,716,292 |
| HOUSEHOLDS, HOUSEHOLD TYPE | ||||
| Family households: Map | 532 | 14,356 | 1,160,118 | 77,538,296 |
| Husband-wife family Map | 436 | 10,256 | 768,198 | 56,510,377 |
| Other family: Map | 96 | 4,100 | 391,920 | 21,027,919 |
| Male householder, no wife present Map | 28 | 1,083 | 95,416 | 5,777,570 |
| Female householder, no husband present Map | 68 | 3,017 | 296,504 | 15,250,349 |
| Nonfamily households: Map | 103 | 4,201 | 568,242 | 39,177,996 |
| Householder living alone Map | 86 | 3,481 | 464,334 | 31,204,909 |
| Householder not living alone Map | 17 | 720 | 103,908 | 7,973,087 |
| HOUSEHOLDS, HISPANIC OR LATINO ORIGIN OF HOUSEHOLDER | ||||
| Not Hispanic or Latino householder: Map | 613 | 17,848 | 1,670,576 | 103,254,926 |
| Hispanic or Latino householder: Map | 22 | 709 | 57,784 | 13,461,366 |
| HOUSEHOLDS, RACE OF HOUSEHOLDER | ||||
| Householder who is White alone | 517 | 13,321 | 1,145,250 | 89,754,352 |
| Householder who is Black or African American alone | 105 | 4,694 | 510,776 | 14,129,983 |
| Householder who is American Indian and Alaska Native alone | 1 | 58 | 10,680 | 939,707 |
| Householder who is Asian alone | 4 | 118 | 21,929 | 4,632,164 |
| Householder who is Native Hawaiian and Other Pacific Islander alone | 0 | 3 | 602 | 143,932 |
| Householder who is Some Other Race alone | 2 | 194 | 19,737 | 4,916,427 |
| Householder who is Two or More Races | 6 | 169 | 19,386 | 2,199,727 |
| HOUSEHOLDS, HOUSEHOLD TYPE BY HOUSEHOLD SIZE | ||||
| Family households: Map | 532 | 14,356 | 1,160,118 | 77,538,296 |
| 2-person household Map | 157 | 5,130 | 469,118 | 31,882,616 |
| 3-person household Map | 140 | 3,712 | 288,790 | 17,765,829 |
| 4-person household Map | 147 | 3,250 | 226,131 | 15,214,075 |
| 5-person household Map | 60 | 1,486 | 109,210 | 7,411,997 |
| 6-person household Map | 18 | 465 | 40,973 | 3,026,278 |
| 7-or-more-person household Map | 10 | 313 | 25,896 | 2,237,501 |
| Nonfamily households: Map | 103 | 4,201 | 568,242 | 39,177,996 |
| 1-person household Map | 86 | 3,481 | 464,334 | 31,204,909 |
| 2-person household Map | 14 | 590 | 84,158 | 6,360,012 |
| 3-person household Map | 2 | 80 | 12,590 | 992,156 |
| 4-person household Map | 0 | 33 | 4,916 | 411,171 |
| 5-person household Map | 1 | 11 | 1,417 | 126,634 |
| 6-person household Map | 0 | 5 | 503 | 48,421 |
| 7-or-more-person household Map | 0 | 1 | 324 | 34,693 |
| HOUSING UNITS | ||||
| Total Housing Units Map | 675 | 19,896 | 1,964,981 | 131,704,730 |
| HOUSING UNITS, OCCUPANCY STATUS | ||||
| Occupied Map | 635 | 18,557 | 1,728,360 | 116,716,292 |
| Vacant Map | 40 | 1,339 | 236,621 | 14,988,438 |
| HOUSING UNITS, OCCUPIED, TENURE | ||||
| Owned with a mortgage or a loan Map | 431 | 9,885 | 687,465 | 52,979,430 |
| Owned free and clear Map | 147 | 4,919 | 474,834 | 23,006,644 |
| Renter occupied Map | 57 | 3,753 | 566,061 | 40,730,218 |
| HOUSING UNITS, VACANT, VACANCY STATUS | ||||
| For rent Map | 4 | 406 | 66,857 | 4,137,567 |
| Rented, not occupied Map | 0 | 31 | 3,273 | 206,825 |
| For sale only Map | 11 | 162 | 21,480 | 1,896,796 |
| Sold, not occupied Map | 7 | 36 | 7,294 | 421,032 |
| For seasonal, recreational, or occasional use Map | 1 | 120 | 42,253 | 4,649,298 |
| For migrant workers Map | 1 | 14 | 999 | 24,161 |
| Other vacant Map | 16 | 570 | 94,465 | 3,652,759 |
| HOUSING UNITS, OCCUPIED, AVERAGE HOUSEHOLD SIZE BY TENURE | ||||
| Total: Map | 3.05 | 2.81 | 2.55 | 2.58 |
| Owner occupied Map | 3.10 | 2.85 | 2.61 | 2.65 |
| Renter occupied Map | 2.54 | 2.67 | 2.43 | 2.44 |
| HOUSING UNITS, OCCUPIED, TENURE BY RACE OF HOUSEHOLDER | ||||
| Owner occupied: Map | 578 | 14,804 | 1,162,299 | 75,986,074 |
| Householder who is White alone Map | 480 | 11,477 | 863,763 | 63,446,275 |
| Householder who is Black or African American alone Map | 88 | 2,959 | 260,603 | 6,261,464 |
| Householder who is American Indian and Alaska Native alone Map | 0 | 41 | 7,239 | 509,588 |
| Householder who is Asian alone Map | 2 | 88 | 13,173 | 2,688,861 |
| Householder who is Native Hawaiian and Other Pacific Islander alone Map | 0 | 3 | 264 | 61,911 |
| Householder who is Some Other Race alone Map | 2 | 117 | 6,714 | 1,975,817 |
| Householder who is Two or More Races Map | 6 | 119 | 10,543 | 1,042,158 |
| Renter occupied: Map | 57 | 3,753 | 566,061 | 40,730,218 |
| Householder who is White alone Map | 37 | 1,844 | 281,487 | 26,308,077 |
| Householder who is Black or African American alone Map | 17 | 1,735 | 250,173 | 7,868,519 |
| Householder who is American Indian and Alaska Native alone Map | 1 | 17 | 3,441 | 430,119 |
| Householder who is Asian alone Map | 2 | 30 | 8,756 | 1,943,303 |
| Householder who is Native Hawaiian and Other Pacific Islander alone Map | 0 | 0 | 338 | 82,021 |
| Householder who is Some Other Race alone Map | 0 | 77 | 13,023 | 2,940,610 |
| Householder who is Two or More Races Map | 0 | 50 | 8,843 | 1,157,569 |
| HOUSING UNITS, OCCUPIED, TENURE BY HISPANIC OR LATINO ORIGIN OF HOUSEHOLDER | ||||
| Owner occupied: Map | 578 | 14,804 | 1,162,299 | 75,986,074 |
| Not Hispanic or Latino householder Map | 559 | 14,313 | 1,135,625 | 69,617,625 |
| Hispanic or Latino householder Map | 19 | 491 | 26,674 | 6,368,449 |
| Renter occupied: Map | 57 | 3,753 | 566,061 | 40,730,218 |
| Not Hispanic or Latino householder Map | 54 | 3,535 | 534,951 | 33,637,301 |
| Hispanic or Latino householder Map | 3 | 218 | 31,110 | 7,092,917 |
| HOUSING UNITS, OCCUPIED, TENURE BY HOUSEHOLD SIZE | ||||
| Owner occupied: Map | 578 | 14,804 | 1,162,299 | 75,986,074 |
| 1-person household Map | 68 | 2,448 | 261,382 | 16,453,569 |
| 2-person household Map | 158 | 4,760 | 407,137 | 27,618,605 |
| 3-person household Map | 130 | 3,060 | 208,649 | 12,517,563 |
| 4-person household Map | 141 | 2,740 | 165,907 | 10,998,793 |
| 5-person household Map | 54 | 1,173 | 76,068 | 5,057,765 |
| 6-person household Map | 17 | 372 | 27,092 | 1,965,796 |
| 7-or-more-person household Map | 10 | 251 | 16,064 | 1,373,983 |
| Renter occupied: Map | 57 | 3,753 | 566,061 | 40,730,218 |
| 1-person household Map | 18 | 1,033 | 202,952 | 14,751,340 |
| 2-person household Map | 13 | 960 | 146,139 | 10,624,023 |
| 3-person household Map | 12 | 732 | 92,731 | 6,240,422 |
| 4-person household Map | 6 | 543 | 65,140 | 4,626,453 |
| 5-person household Map | 7 | 324 | 34,559 | 2,480,866 |
| 6-person household Map | 1 | 98 | 14,384 | 1,108,903 |
| 7-or-more-person household Map | 0 | 63 | 10,156 | 898,211 |
Loading...